Distributed Load Testing on EKS with k6 Operator

Hardik Shah
Cloud Architect & AWS Expert
A single k6 process tops out around a few thousand virtual users before the machine running it becomes the bottleneck, not the system under test. k6 Operator splits a load test across a Kubernetes cluster instead, so the ceiling becomes the cluster's capacity rather than one box's CPU.
Where a single k6 run stops working
k6 runs as one process. Every virtual user it simulates shares that process's CPU and network stack, and past a certain point the test stops measuring the target and starts measuring the load generator. On a checkout flow test at roughly 4,000 VUs on a large EC2 instance, p95 latency on the load generator's own outbound calls started climbing before the target service showed any strain.
The usual workaround is running several k6 instances by hand and adding up their output afterward. It works once. It doesn't survive being run every week by whoever happens to be on call, because someone has to remember how many instances, split which way, and reconciled how.
What the Operator actually does
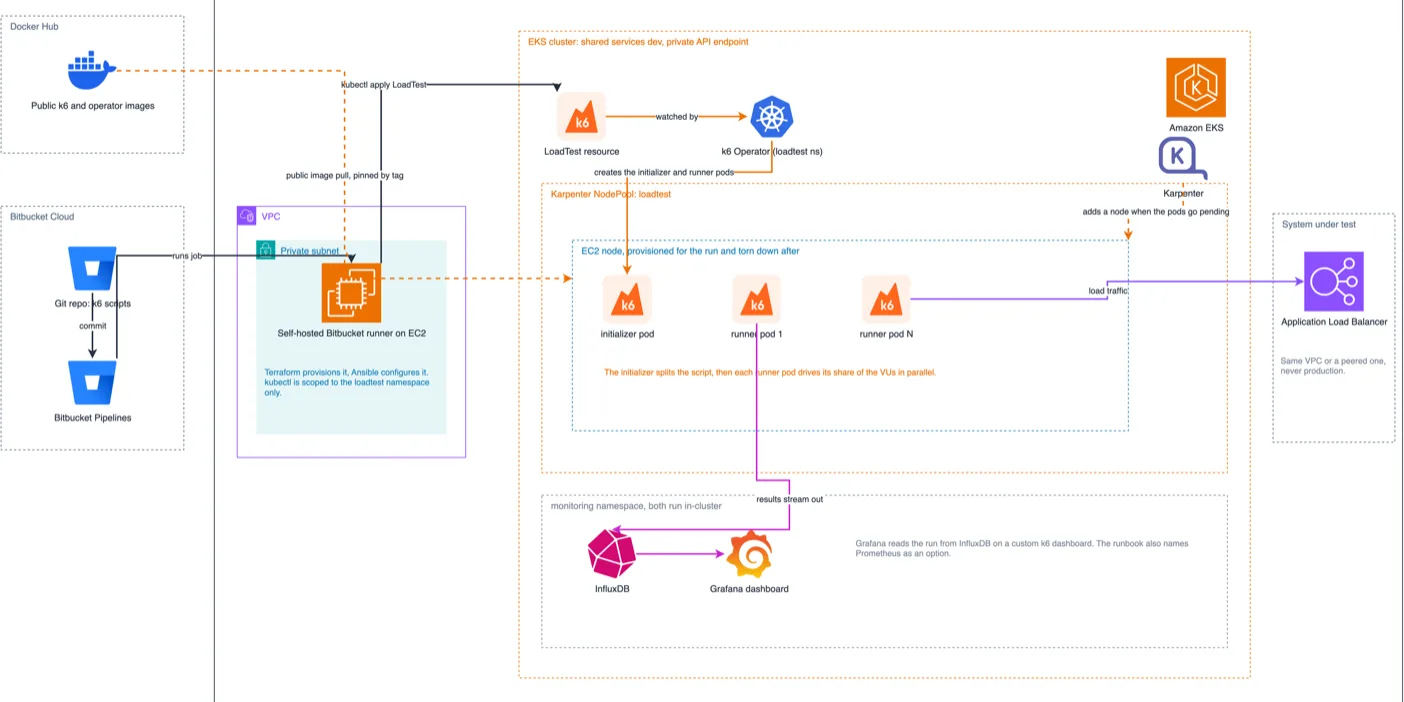
k6 Operator is a Kubernetes controller. A test gets defined as a LoadTest custom resource, applied with kubectl, and the operator handles the rest: an initializer pod parses the script and works out how to split it, then one runner pod per segment carries out its share of the virtual users in parallel. Results from every runner pod stream to the same time-series backend, so the output is one merged result set instead of several to add up by hand.
The diagram below is the shape this runs in production: a Bitbucket pipeline triggers the test from a self-hosted runner, the operator schedules pods onto a Karpenter-managed node pool sized for the run, and results land in InfluxDB behind a Grafana dashboard.

The pieces worth explaining
- Scoped runner access. The pipeline runs on a self-hosted Bitbucket runner rather than a cloud one, because it needs a private
kubectlcontext scoped to one namespace and nothing else. Terraform provisions the EC2 instance, Ansible configures it, and its Kubernetes access never extends past theloadtestnamespace: it can apply aLoadTestresource and read pod status, nothing the operator itself doesn't also need. - Karpenter over a fixed node group. A fixed-size node group meant either paying for idle capacity between tests or watching a run queue behind a scale-up event. A Karpenter
NodePoolscoped to theloadtestnamespace adds a node when the initializer and runner pods go pending, and reclaims it once they finish. The cost of a load test ends up close to the cost of the run itself. - Digest-pinned images. Docker Hub sits outside the AWS account entirely. The operator and k6 runner images are public, pulled by digest rather than
latest, so a run in March uses the exact image a run in January used. - Short-retention in-cluster monitoring. InfluxDB and Grafana run in-cluster rather than as a managed service, because retention here is short: two weeks of run history, enough to compare this week's numbers against last week's, then deleted. A Prometheus remote-write path is documented as an alternative for teams that already run Prometheus and would rather not stand up a second time-series database for this.
What changes about running a load test
The team owning the checkout flow now runs this test against staging before every release that touches payment or inventory code, not just before a big launch. That only happened because the test went from a half-day manual exercise to a kubectl apply a pipeline step triggers on its own, five minutes end to end including result upload.
It also means the artifact under version control is the test's definition, not tribal knowledge about how someone used to wire three k6 instances together. The LoadTest resource lives in the same repo as the k6 script, reviewed in the same pull request as changes to the script itself.
Where not to use it
If the peak load target is a few thousand VUs and one instance already gets there, the operator is a Kubernetes cluster and a controller to maintain for no measurable gain. It earns its keep once a single process becomes the constraint, not before.
Target environment matters as much as the tooling. Point this at anything shared with production traffic, peered VPC or not, and it's a real load test against a real system with real consequences. Keep it against staging, or an environment built to take the hit.
About Hardik Shah
Hardik runs load tests on the same EKS clusters he builds, which is how he ended up caring about k6 Operator instead of a single pod hitting its own CPU ceiling. Performance testing on Kubernetes is a recurring part of his platform work.